How Risky Is My Portfolio? – Free Portfolio Risk Calculator
Last updated: July 2026
Wondering "how risky is my portfolio"? Use our free portfolio risk calculator to find out. Understanding portfolio risk is essential for any investor—it's not as simple as looking at individual stock risk. This tool reveals how your entire portfolio behaves together, considering volatility, diversification, and concentration. Many investors assume that holding multiple stocks means low risk, but that's not always true. The calculator analyzes your holdings to show how risky your portfolio really is, taking into account how your stocks move together. Get a clear risk score and key metrics in minutes.
Want to understand what drives portfolio risk? Read the guide →
Calculating Portfolio Risk
Calculating portfolio risk means measuring how your whole basket behaves—not just adding up individual stock risks. You need each holding's weight, its volatility, and how it correlates with everything else. The result is a portfolio-level figure (often standard deviation of returns or a simple 1–10 score) you can compare across allocations or over time.
Our free portfolio risk calculator does this for you: enter tickers and weights below and get a risk score in minutes. No spreadsheet or signup required.
How to Calculate Portfolio Risk
To calculate portfolio risk, you need your holdings, their weights, and an approach that accounts for volatility and correlation. Use the tool below: enter your stock and ETF tickers with portfolio weights, and the calculator produces a risk score (1–10) and key metrics. No Excel or formula required—it runs in your browser.
Risk Calculator for Stocks
This risk calculator for stocks (and ETFs) uses your tickers and weights to estimate portfolio-level volatility and a simple 1–10 risk score. It is built for equity-heavy portfolios: enter each stock position as a percent of the whole, run the analysis on the tool linked below, and read how much your combined basket may swing and how concentrated risk is.
Calculate Your Portfolio Risk
Enter your stock and ETF tickers with their portfolio weights to see your risk score.
Use Portfolio Risk CalculatorWhat drives portfolio risk?
Portfolio risk is about how holdings behave together — not just how risky each holding is on its own.
What Is Portfolio Risk?
Portfolio risk is the overall uncertainty and potential for loss across your entire investment portfolio. Unlike individual stock risk, which measures how volatile a single stock is, portfolio risk considers how all your investments work together. When stocks move in similar patterns—what's called correlation—your portfolio risk can be higher than you think, even if you own many different stocks.
Diversification helps reduce portfolio risk, but only when your investments don't all move together. For example, owning 20 technology stocks might seem diversified, but if they all rise and fall together, your portfolio risk is still high. True diversification means holding investments that respond differently to market conditions, which can lower your overall portfolio risk.
Concentration risk is another key factor. If a single stock or sector makes up too much of your portfolio, that position can dominate your portfolio risk regardless of how many other stocks you own. A portfolio risk calculator helps you see these relationships clearly, showing you where your real risk comes from.
How to Calculate Portfolio Risk
To calculate portfolio risk, you need your holdings (tickers) and their weights. The portfolio risk calculator uses historical volatility and correlations between those holdings to estimate how much your total portfolio value can swing. It then maps that to a single portfolio risk score (1–10) so you can compare different portfolios or track your risk over time. You don’t do the math yourself—enter your data in the tool and read the score, volatility, and drawdown.
Portfolio Risk Score Interpretation
The risk score (1–10) tells you where your portfolio sits on the risk spectrum: low (1–3), medium (4–7), or high (8–10). Low means lower volatility and shallower drawdowns; high means higher volatility and deeper potential losses. Interpretation depends on your goals and time horizon—a high score isn’t “bad” if you have a long horizon and high tolerance; it’s wrong for you if you need stability or might panic-sell in a crash. Use the table below to see what each range typically means and what kind of outcome to expect.
Stock Portfolio Risk Calculator Step-by-Step
- Gather your tickers and the percentage of the portfolio each represents (weights).
- Open the portfolio risk calculator (Build page).
- Add each ticker and its weight, or load a sample portfolio.
- Run the analysis and read your portfolio risk score, volatility, and drawdown.
- Compare the result to your target risk level and adjust allocations if needed; re-run after changes.
How This Portfolio Risk Calculator Works
Inputs
- Stock and ETF tickers
- Portfolio weights or allocations
What We Analyze
- Historical volatility
- Correlation between assets
- Concentration risk
- Risk-adjusted contribution of each asset
Your Final Risk Score
The calculator outputs a normalized risk score mapped to intuitive risk levels from 1 to 10. This score reflects how your portfolio has behaved historically, considering all the factors above. It's important to remember that this score describes portfolio behavior based on past data, not a prediction of future performance. Use it to understand your portfolio's risk characteristics and make more informed allocation decisions.
Portfolio Risk vs Individual Stock Risk
One of the biggest misconceptions about investing is that a single risky stock defines your entire portfolio risk. In reality, portfolio risk depends on how much of your portfolio that stock represents and how it interacts with your other holdings. A small position in a volatile stock might have minimal impact on your overall portfolio risk, while an overweight position in a seemingly safe stock could actually increase your portfolio risk if it's highly correlated with your other investments.
ETFs can either reduce or amplify portfolio risk depending on their composition. A broad market ETF might lower your portfolio risk by providing instant diversification, but a sector-specific ETF could increase concentration risk if you already hold individual stocks in that sector. The portfolio risk calculator accounts for these relationships, showing you the true risk profile of your combined holdings.
For example, imagine you own Apple stock at 30% of your portfolio and an S&P 500 ETF at 40%. While the ETF itself might seem low-risk, if it already contains significant Apple exposure, your effective Apple concentration is much higher than 30%. The portfolio risk calculator reveals these hidden concentrations and correlations, giving you a complete picture of your actual risk exposure.
Understanding Your Portfolio Risk Score
| Risk Score Range | Meaning | Example Portfolio Outcome |
|---|---|---|
| 1–2 | Very conservative: minimal volatility, high diversification | In a bad year, portfolio might fall ~10–15%; smooth ride, lower long-term return |
| 3–4 | Conservative: low to moderate volatility, well diversified | Drawdowns often in the mid-teens; suited to short horizons or low tolerance |
| 5–6 | Balanced: moderate volatility, mix of growth and stability | Typical drawdowns 15–25% in a severe bear market; market-like risk |
| 7–8 | Growth: higher volatility, growth-oriented, some concentration | Can fall 25–35% in a bad year; higher expected return over time |
| 9–10 | Aggressive: high volatility, concentrated positions | Drawdowns of 30–40%+ possible; for long horizons and high tolerance only |
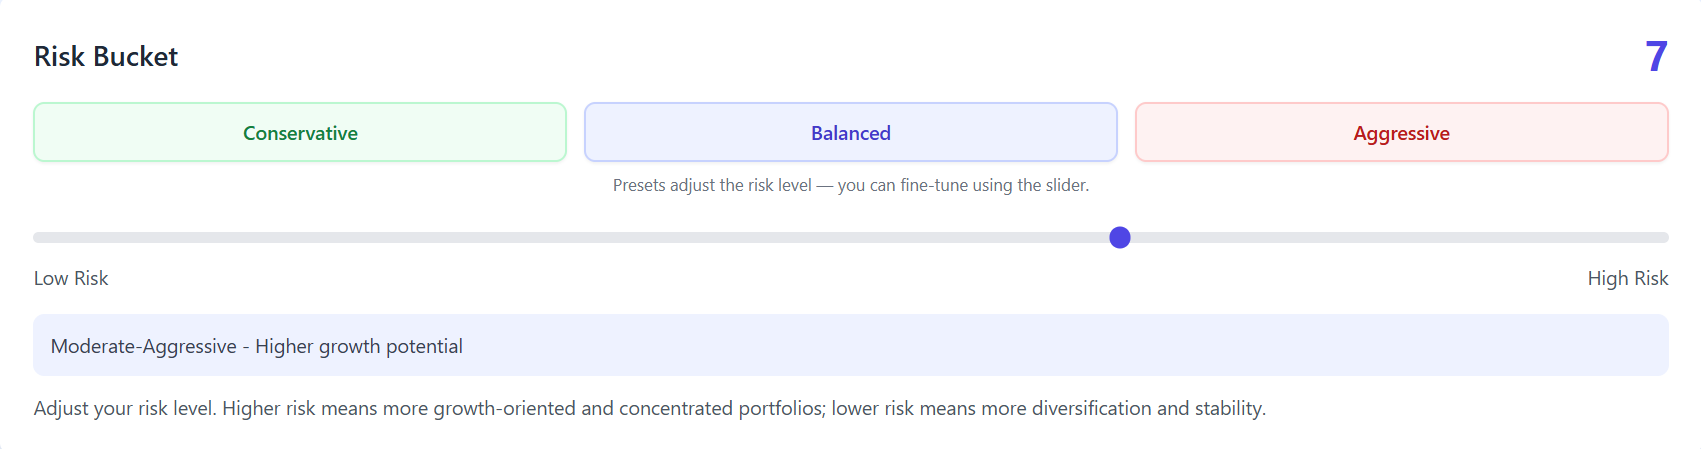
The risk selector interface allows you to choose preset risk levels (Conservative, Balanced, Aggressive) or fine-tune your risk preference using the slider. The calculator uses this risk level to analyze your portfolio and provide a matching risk score.
This risk score reflects your portfolio's historical behavior and risk characteristics, not your personal risk tolerance. Your personal risk tolerance is about how much volatility you're comfortable with emotionally and financially. The portfolio risk score shows you what your current portfolio actually delivers in terms of risk, which you can then compare to your personal preferences to see if adjustments are needed.
Who Should Use a Portfolio Risk Calculator?
- Long-term investors who want to understand their portfolio's risk profile
- ETF investors who need to see how their funds interact with individual stock holdings
- Retirement planners assessing whether their portfolio risk matches their time horizon
- DIY portfolio builders who want to verify their diversification is working
- Anyone unsure how risky their portfolio is and needs objective analysis
Common Portfolio Risk Mistakes
- Confusing number of holdings with diversification—owning many stocks in the same sector doesn't reduce risk
- Overweighting a single stock or sector without realizing the concentration risk
- Assuming ETFs are always low risk, ignoring sector overlap and correlation with existing holdings
- Ignoring correlations between assets, missing how stocks move together
- Focusing only on returns without considering the risk taken to achieve those returns
What to Do After Measuring Your Portfolio Risk
- Adjust allocations to match your risk preference—reduce positions that push your risk too high or too low
- Reduce concentration by limiting single-stock and sector weights to acceptable levels
- Compare your portfolio risk to benchmarks like the S&P 500 to see if you're taking more or less risk than the market
- Rebalance based on risk contribution, focusing on positions that drive the most portfolio risk
If your portfolio risk is higher than your comfort level, see our portfolio risk guide and conservative vs aggressive comparison. Use the portfolio optimizer to build a portfolio that matches your risk preferences.
This portfolio risk calculator is designed to help you understand your portfolio's risk characteristics based on historical data. It's a tool for education and analysis, not a prediction of future returns or a guarantee of performance. Past behavior doesn't guarantee future results, but understanding how your portfolio has behaved can inform better decision-making. Use this information alongside your personal risk tolerance, investment goals, and time horizon to make informed choices about your portfolio allocation.
Frequently Asked Questions
What is a portfolio risk score?
A portfolio risk score is a single number (usually 1–10) that summarizes how much risk your whole portfolio carries. It’s derived from portfolio-level volatility, and often concentration and correlation, and is normalized so you can compare different portfolios or track your risk over time. Low (1–3) means lower volatility and shallower drawdowns; high (8–10) means higher volatility and deeper potential losses. It reflects how your portfolio has behaved historically, not a forecast of future returns.
How do I interpret my risk result?
Compare your risk score and volatility to your time horizon and comfort level. If you need the money soon or can’t stomach big swings, a low or medium score (1–6) is usually appropriate. If you have a long horizon and accept volatility, a higher score (7–10) may be fine. Use the comparison table on this page to see what each range typically means and what kind of drawdown to expect. Then adjust your allocations or risk level if the result doesn’t match your goals.
Why does correlation matter?
Correlation measures how similarly your holdings move together. When correlation is high, stocks tend to rise and fall together, so diversification doesn’t help much and portfolio risk stays high even with many positions. When correlation is low, losses in one holding may be offset by others, which can lower portfolio risk. The portfolio risk calculator uses correlations (from historical data) when it computes your risk score, which is why the same set of stocks can produce different risk depending on weights and correlations.
Does diversification reduce risk?
Usually yes—spreading across many names and sectors often reduces portfolio risk because not everything moves together. But diversification doesn’t always reduce risk: if you’re diversified across many stocks in the same sector or theme, correlation can stay high and risk can remain elevated. The calculator’s output shows the result for your actual portfolio; use it to see whether your diversification is really lowering your risk score and volatility.
How often should I recalculate risk?
Recalculate when your portfolio meaningfully changes (you add or sell holdings, or weights have drifted), when your goals or time horizon change (e.g. approaching retirement), or when you want to confirm you’re still in your target risk range. There’s no fixed rule—some people run the portfolio risk calculator quarterly, others when they rebalance. Don’t change your risk level only because the market just crashed or rallied; align risk with long-term goals.
How do I calculate portfolio risk?
Use a portfolio risk calculator (like this one) that considers your holdings, weights, volatility, and correlation. Enter your tickers and weights; the tool computes portfolio-level volatility and often concentration to produce a risk score (e.g. 1–10). You can also approximate it with the variance of a weighted portfolio of returns, but a dedicated calculator is easier and more accurate.
Is there a formula for calculating portfolio risk?
Yes. Portfolio risk is often measured by portfolio variance or standard deviation of returns. The formula uses each asset's volatility, the weights you hold, and the correlations between assets. In practice, tools like this calculator do that math for you so you get a simple risk score (1–10) you can compare across portfolios or over time.